Creating meaningful data visualization that moves your business forward
project completed while employed at Vervint
collaboration with Matthew Smith, Yee Vang, Tabitha rivera, and Jen Nowlin.
my role was to lead the research effort. Identifying, scheduling, and running the interviews.
my role was to lead the research effort. Identifying, scheduling, and running the interviews.
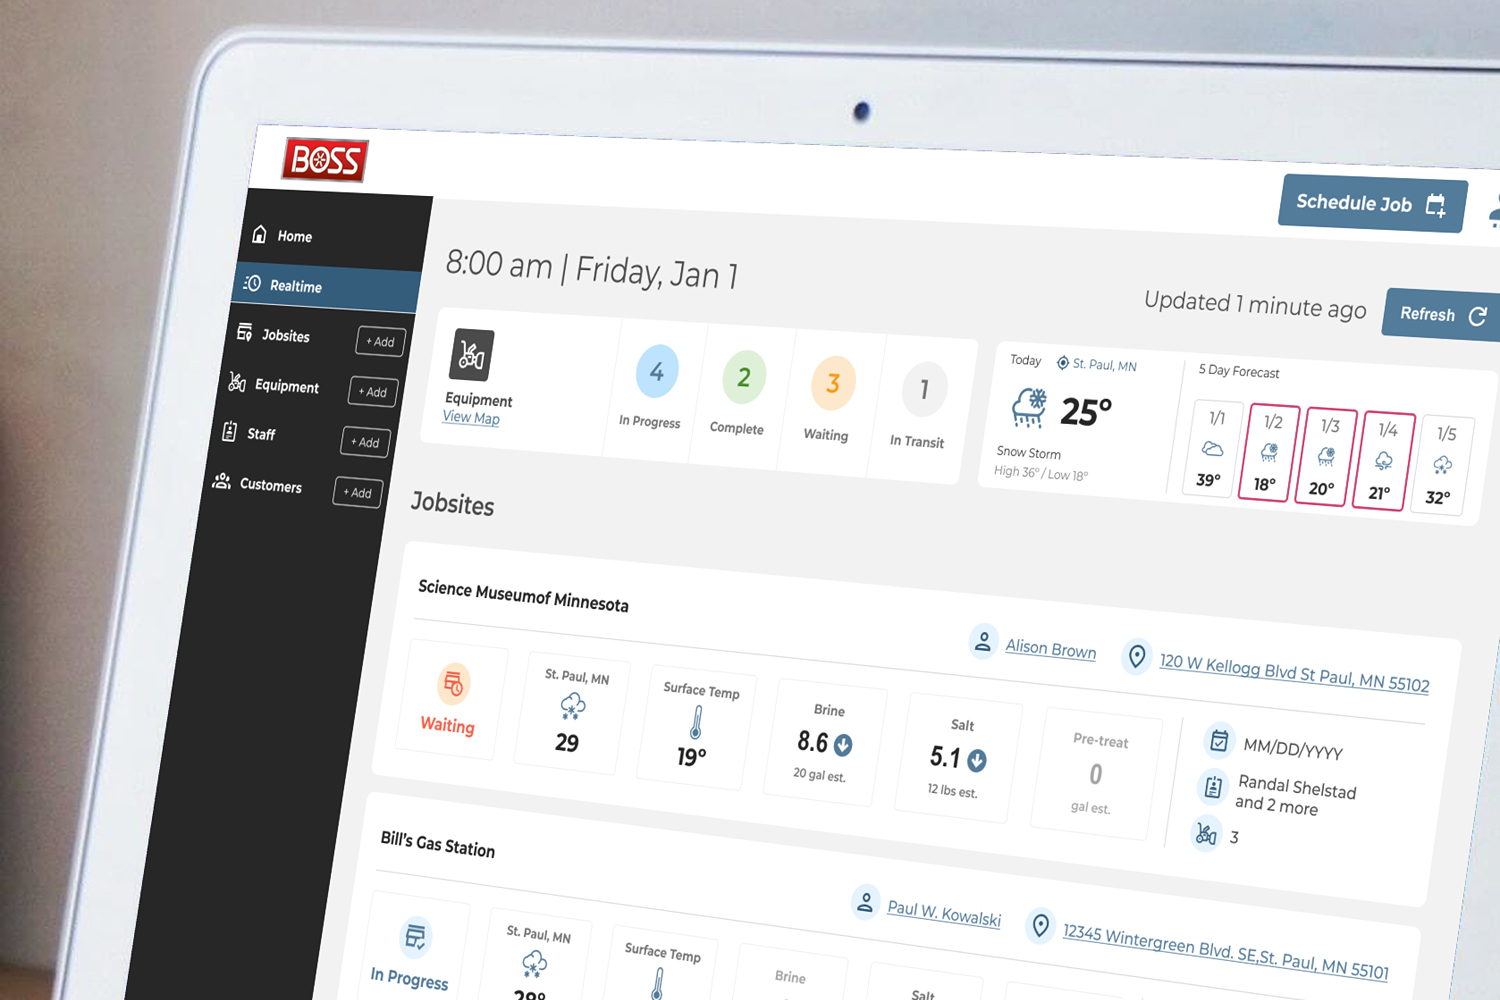
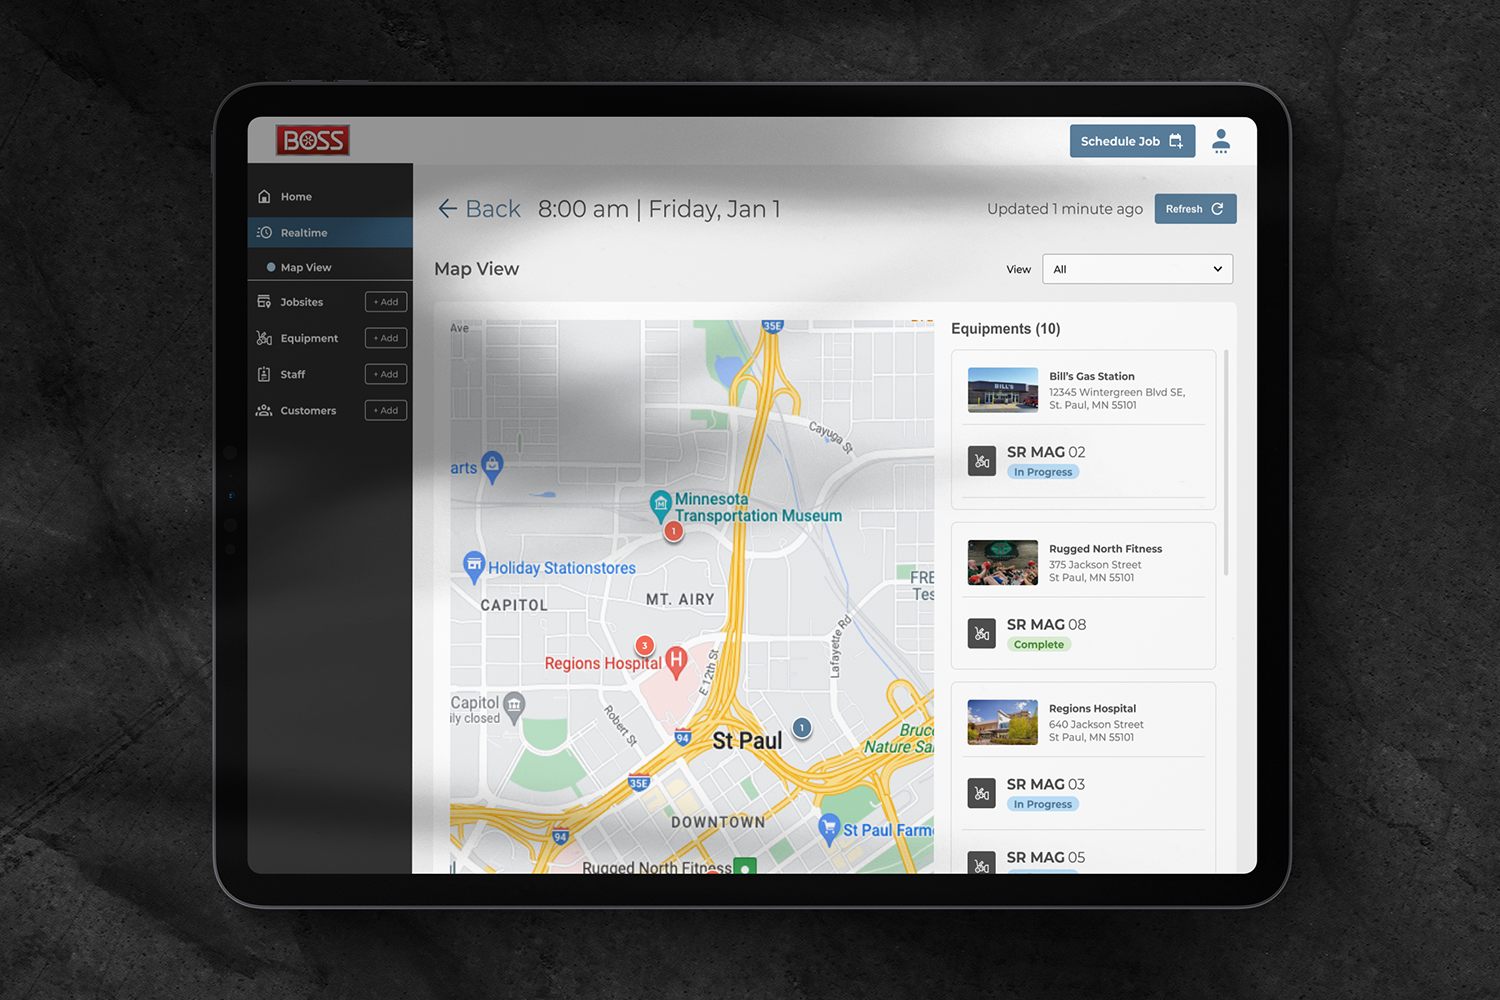
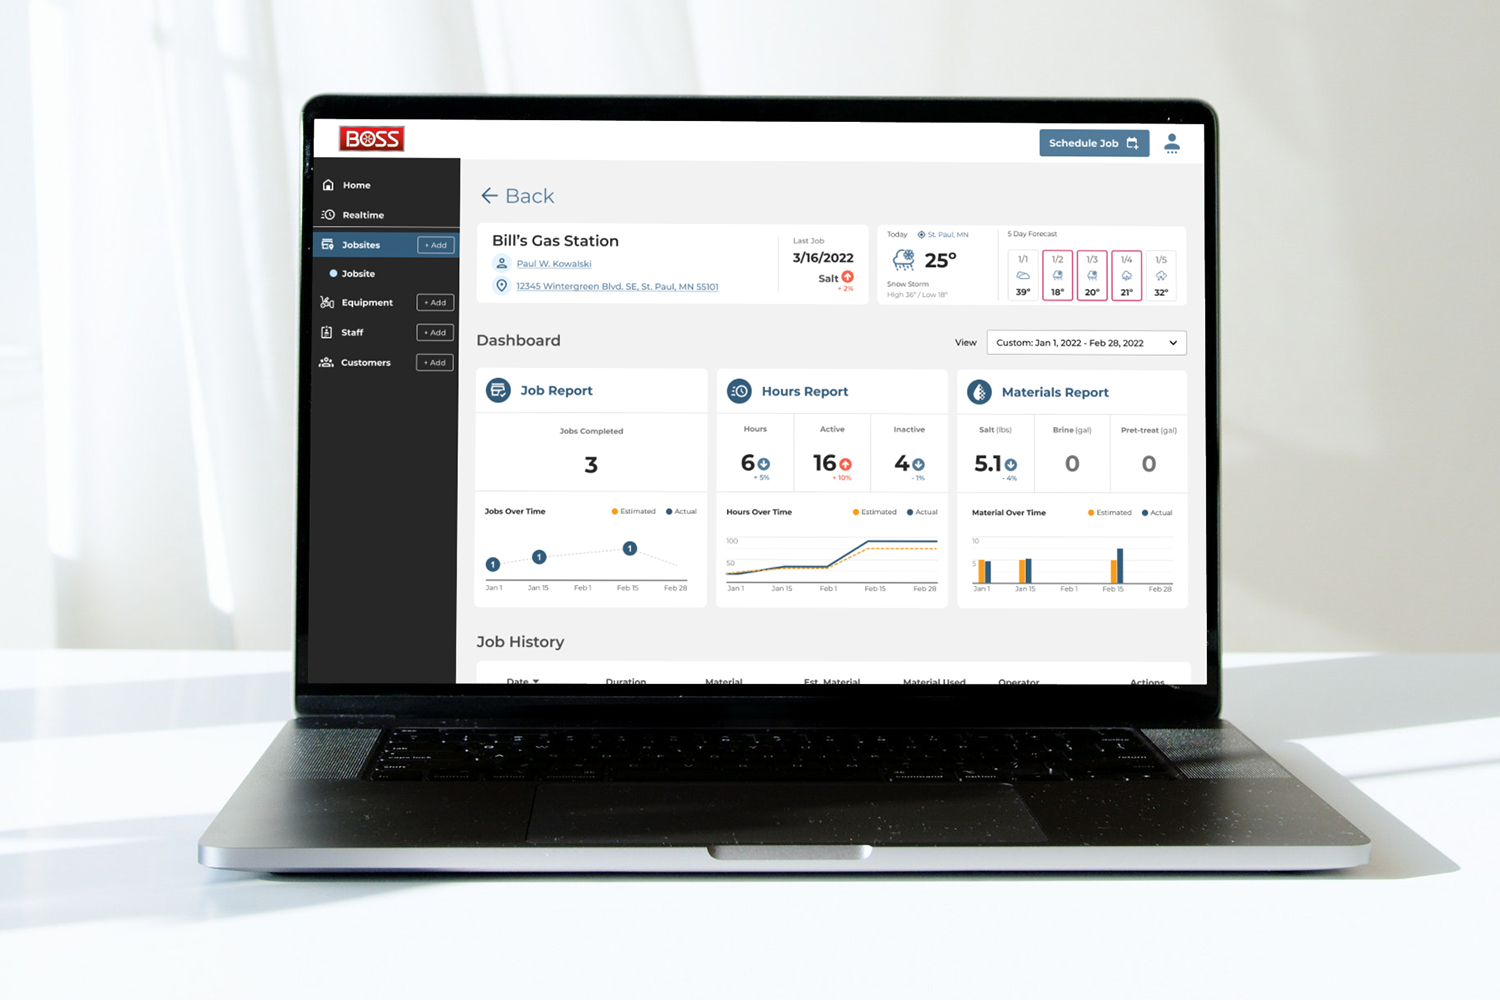
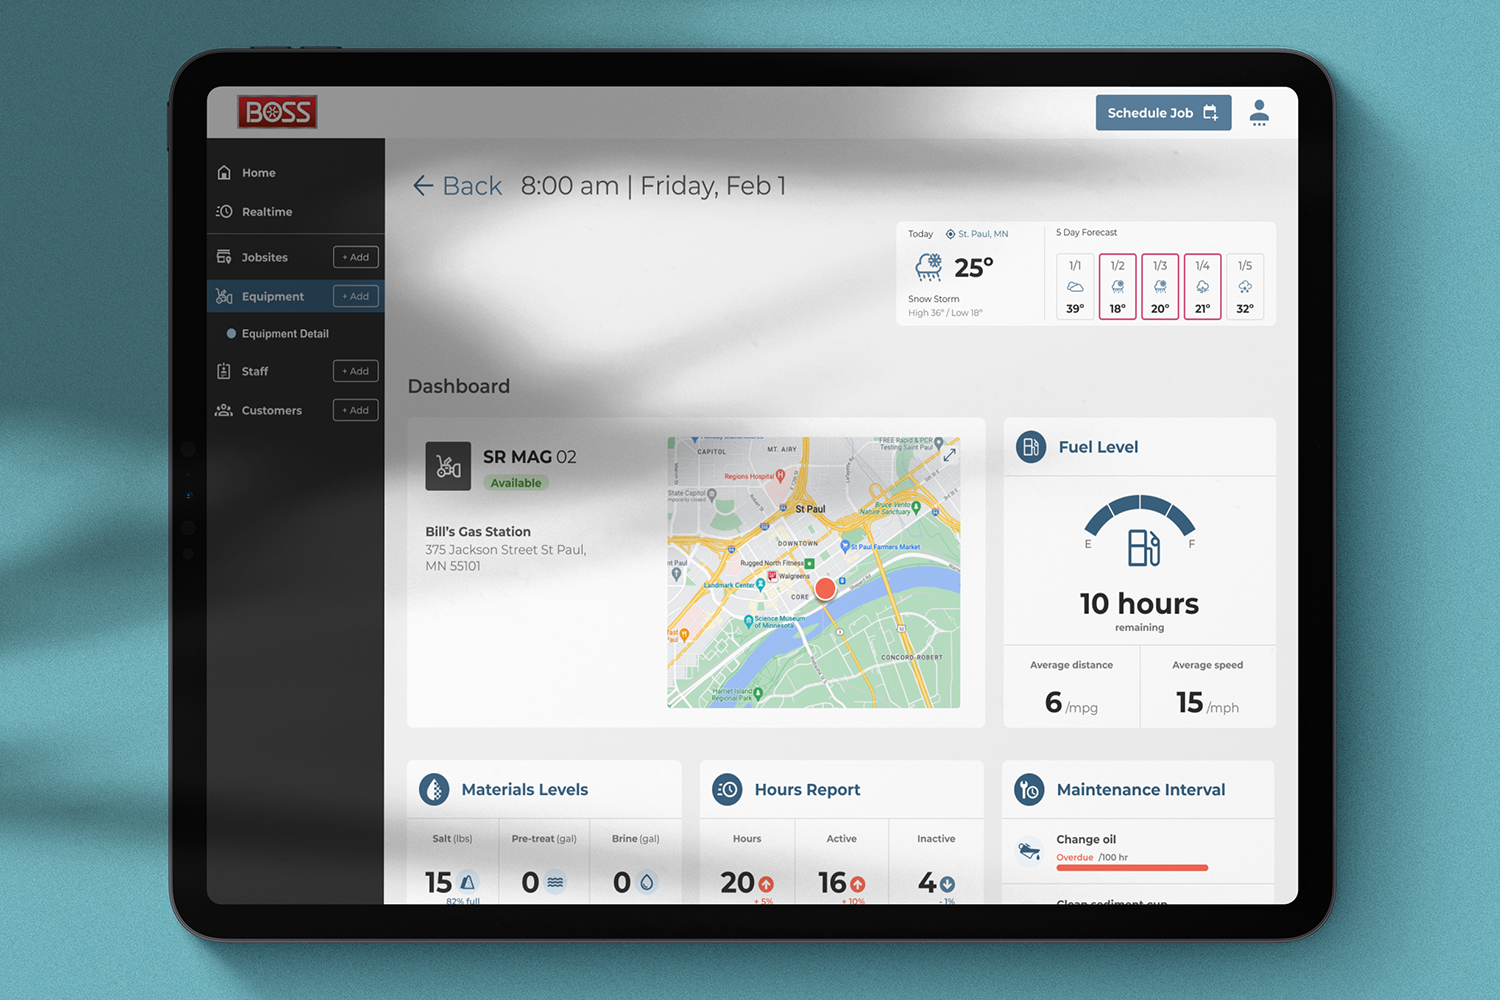
Boss snowplow was releasing their snowrator, an innovative product for clearing sidewalks of snow and ice. the machine included telematics sharing the volume of liquid or solids spread on the sidewalks, the route that the machine completed, the duration the project took, as well as live weather data from that location.
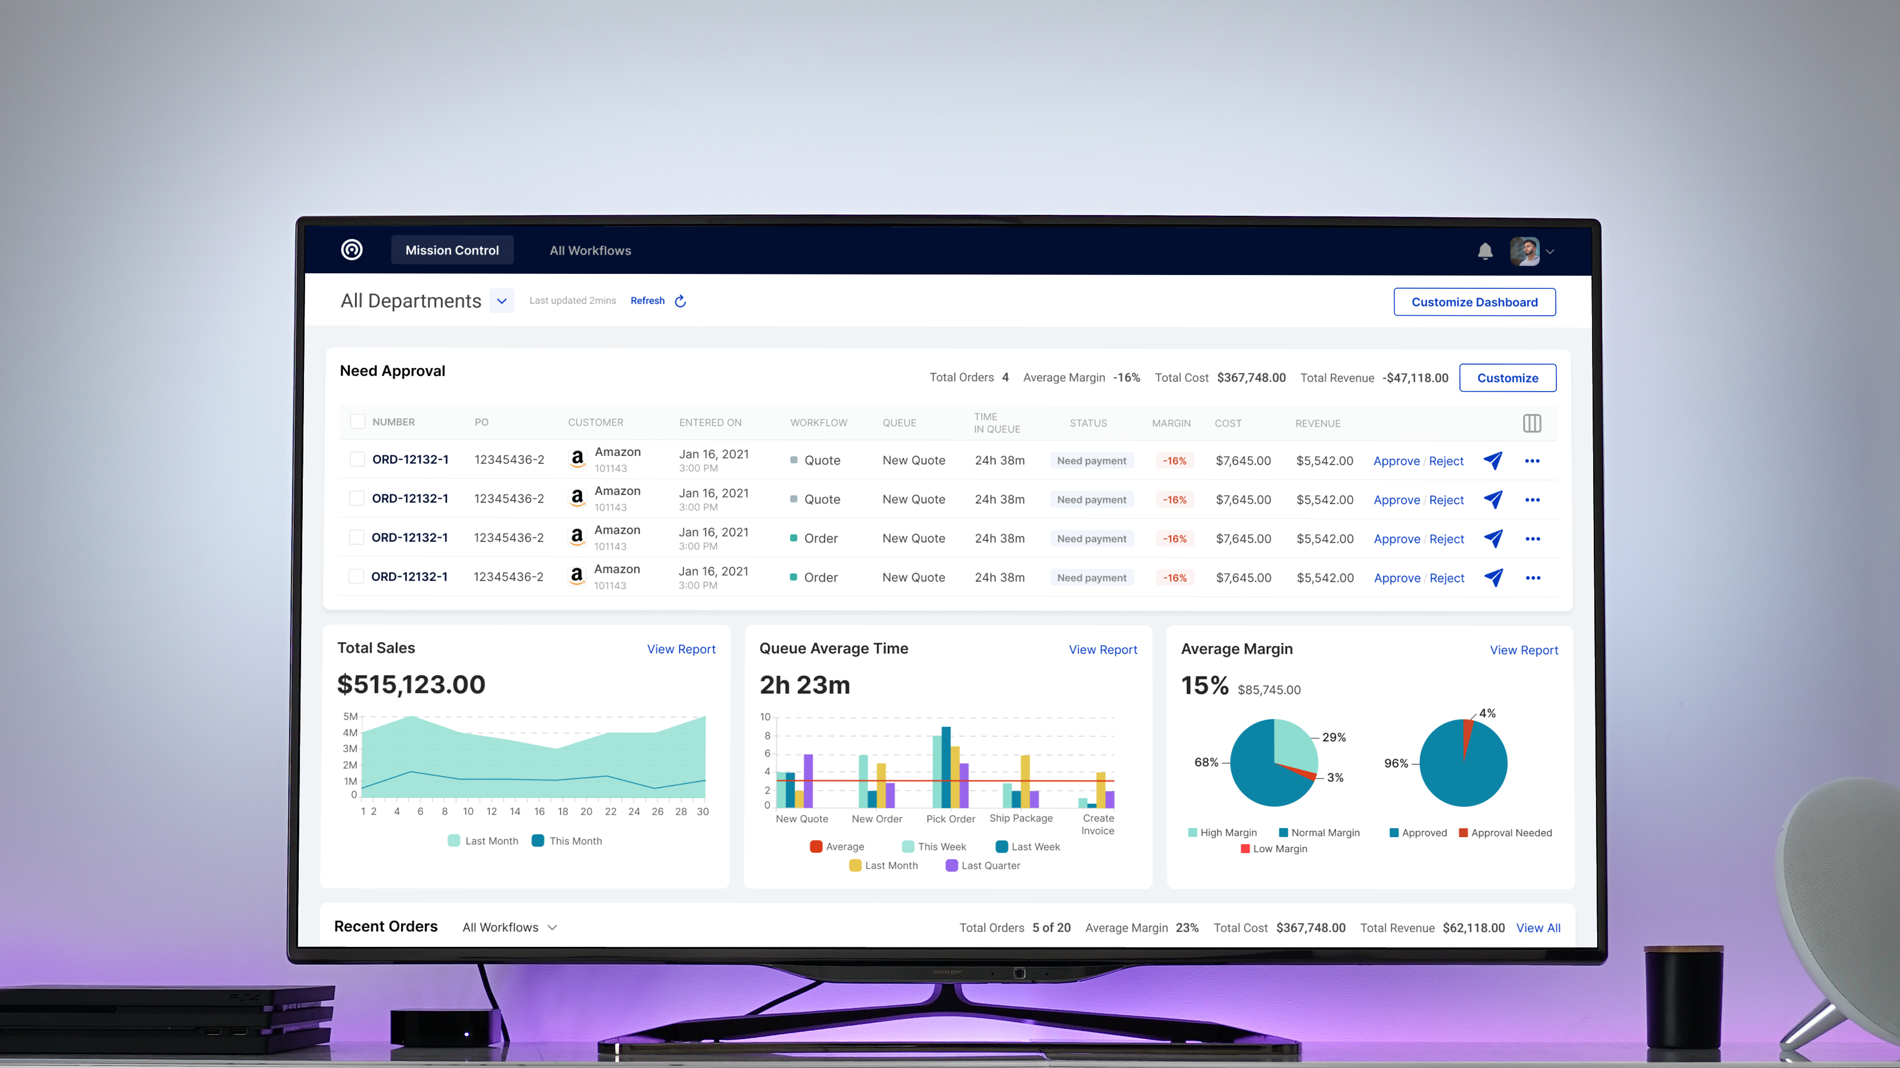
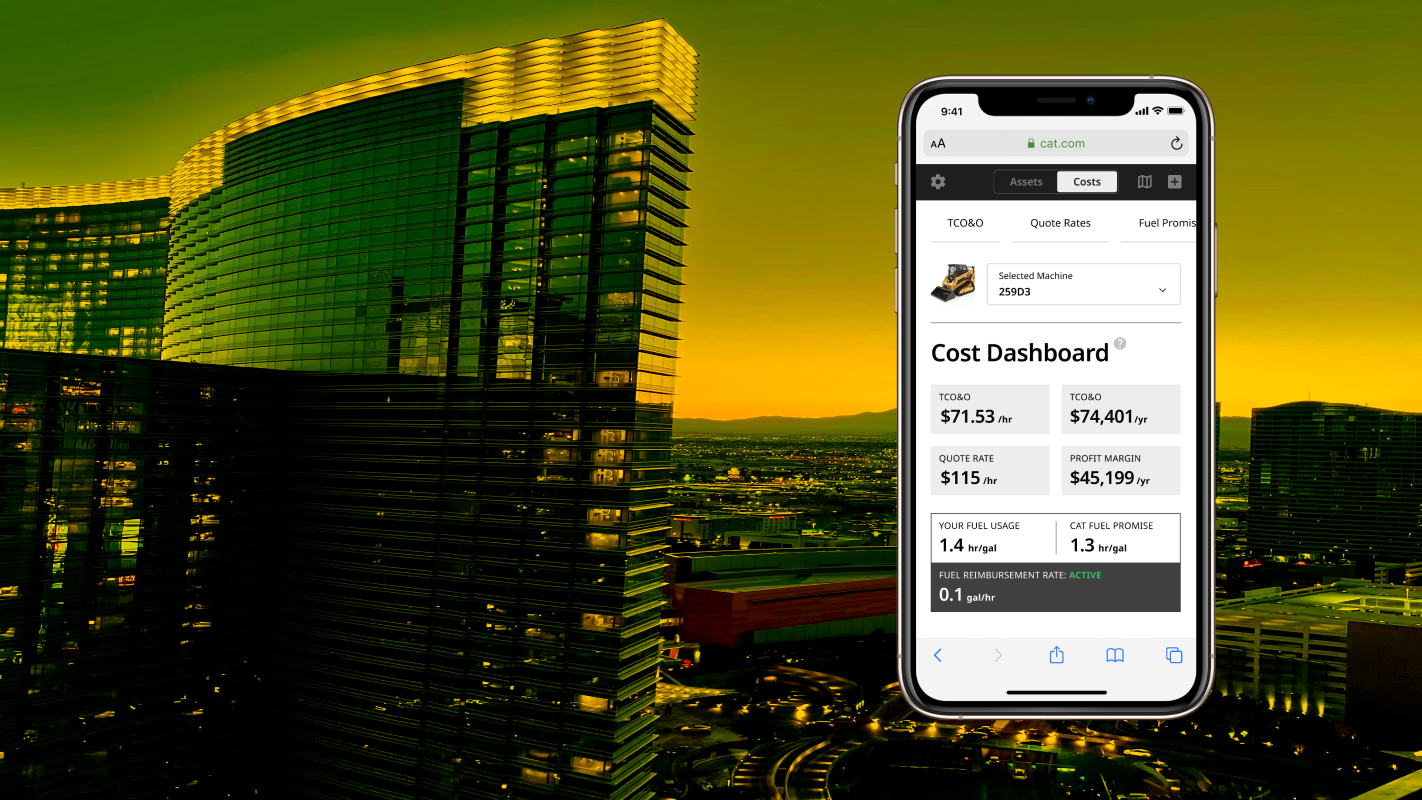
This was incredible, valuable data that would be helpful to fleet managers working for snow removal organizations. Boss hired us to create data visualizations and a dashboard and then gather feedback from fleet managers about what data they would use and how they might use it. our timeline was aggressive, less than two months from start to trade show to feedback synthesis!
We created our prototype and then set out to talk to fleet managers at the Snow and ice management tradeshow in Milwaukee, Wisconsin. it was a great show!
