Designed with AJ PApin, Claire Tomm, and Barret Hoster
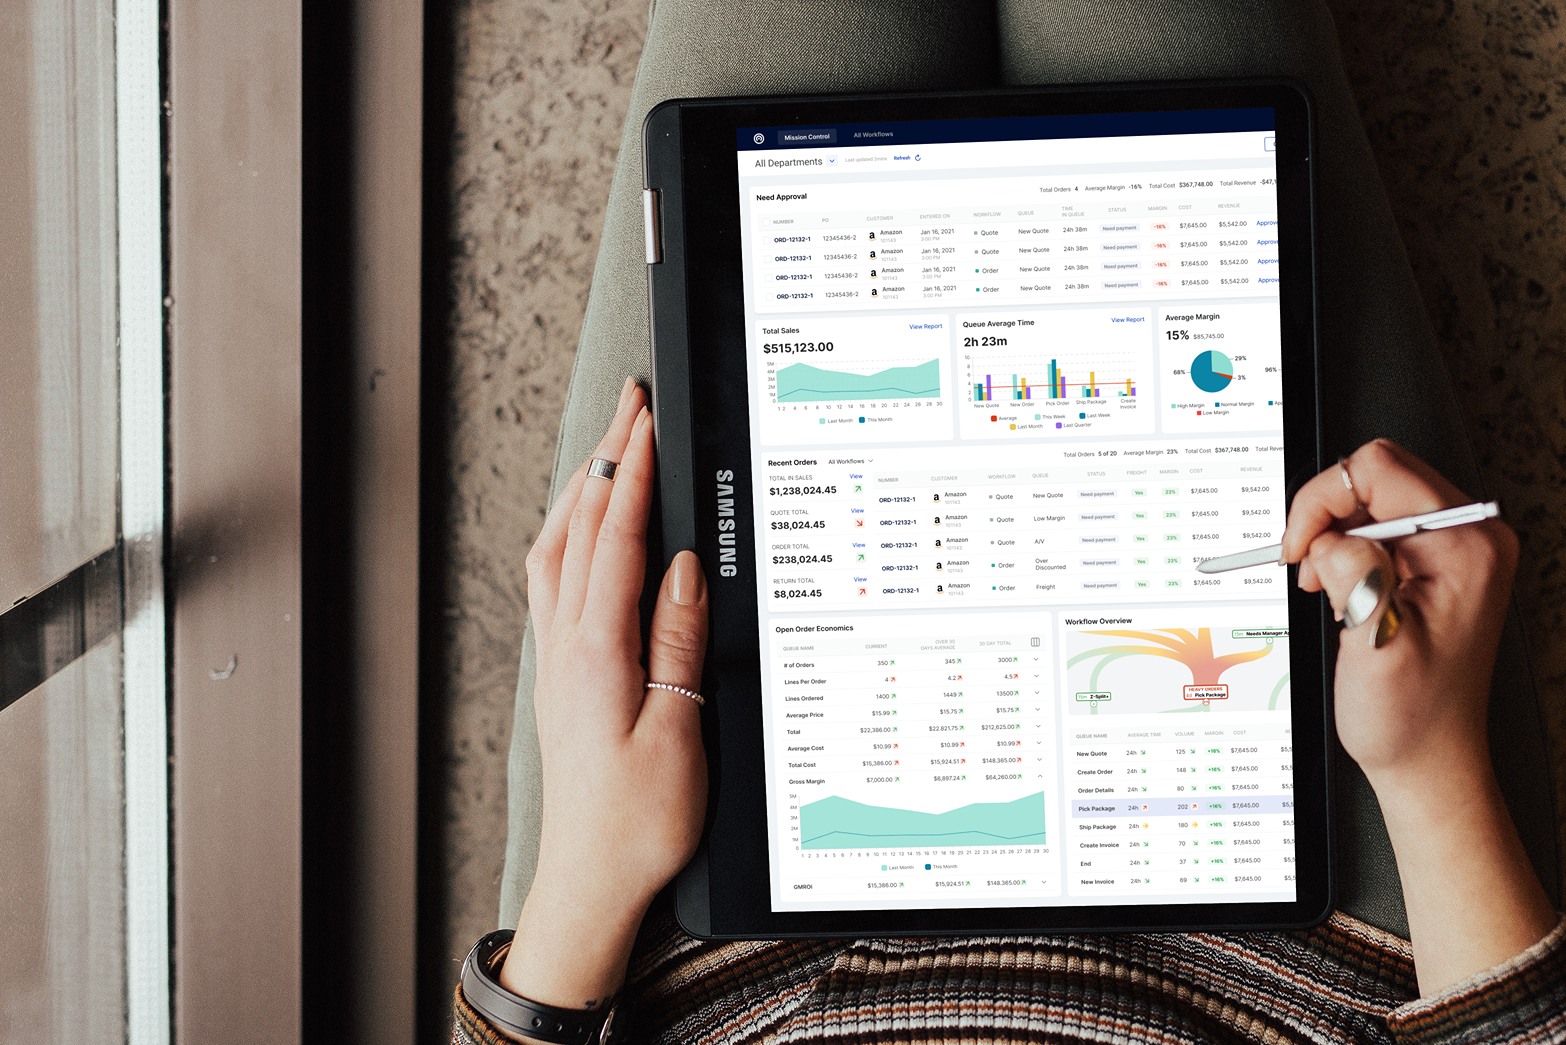
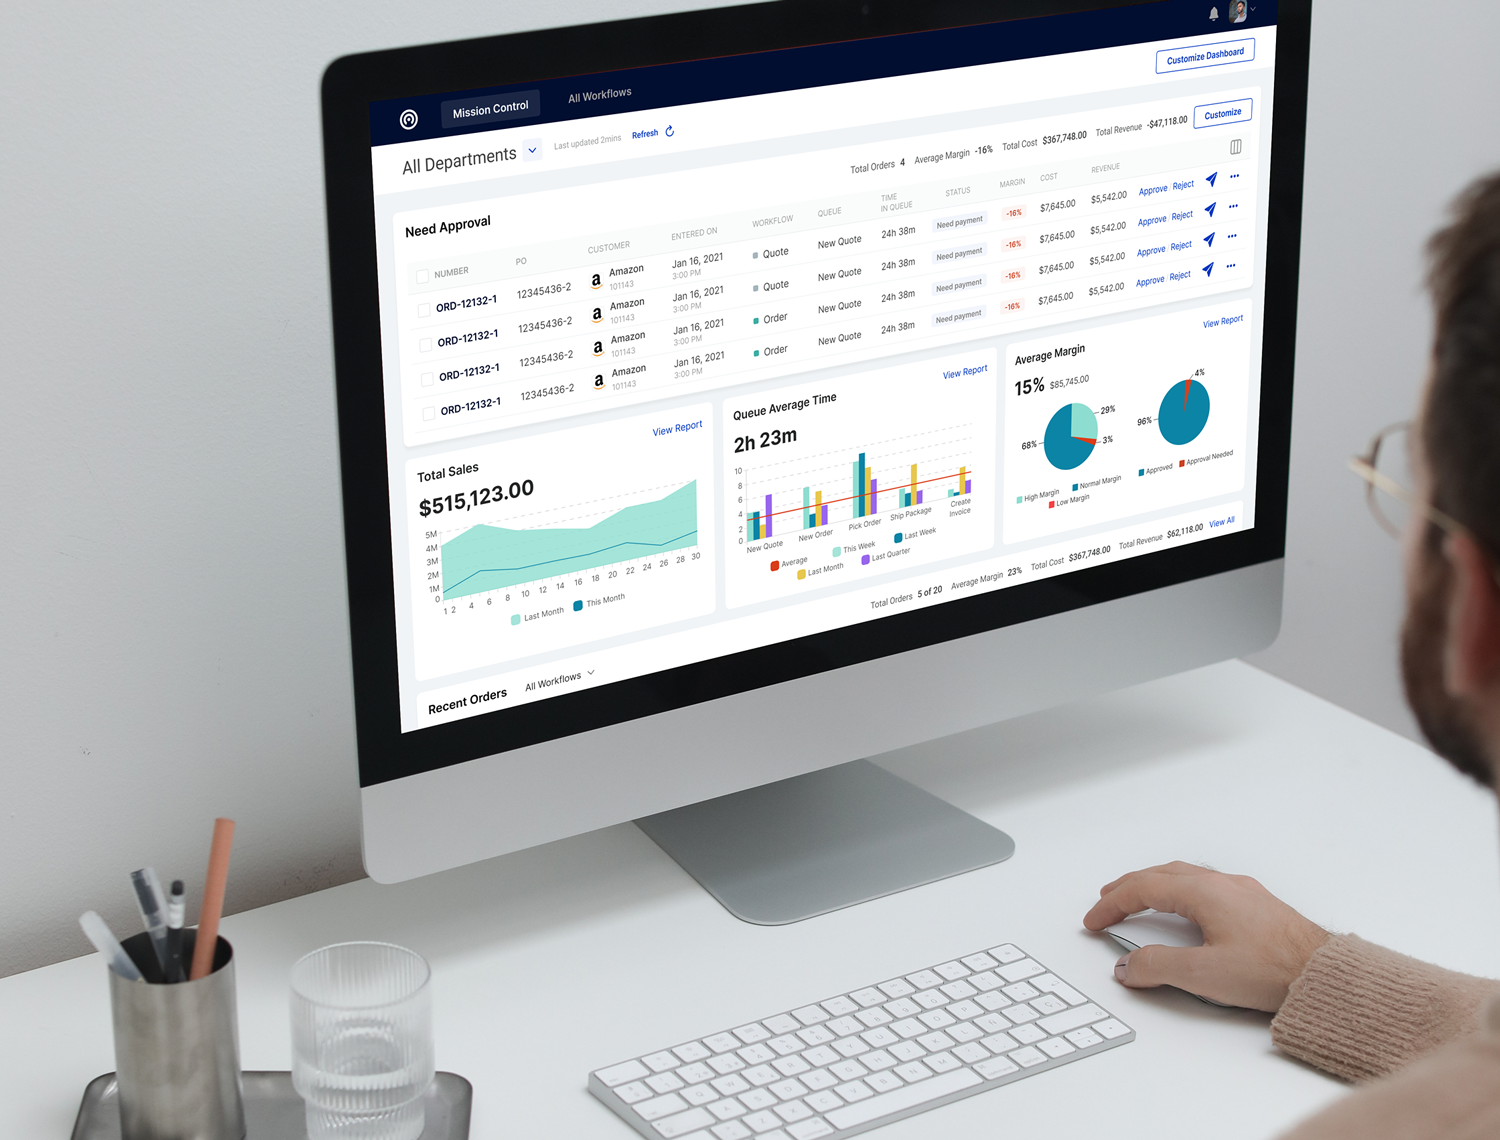
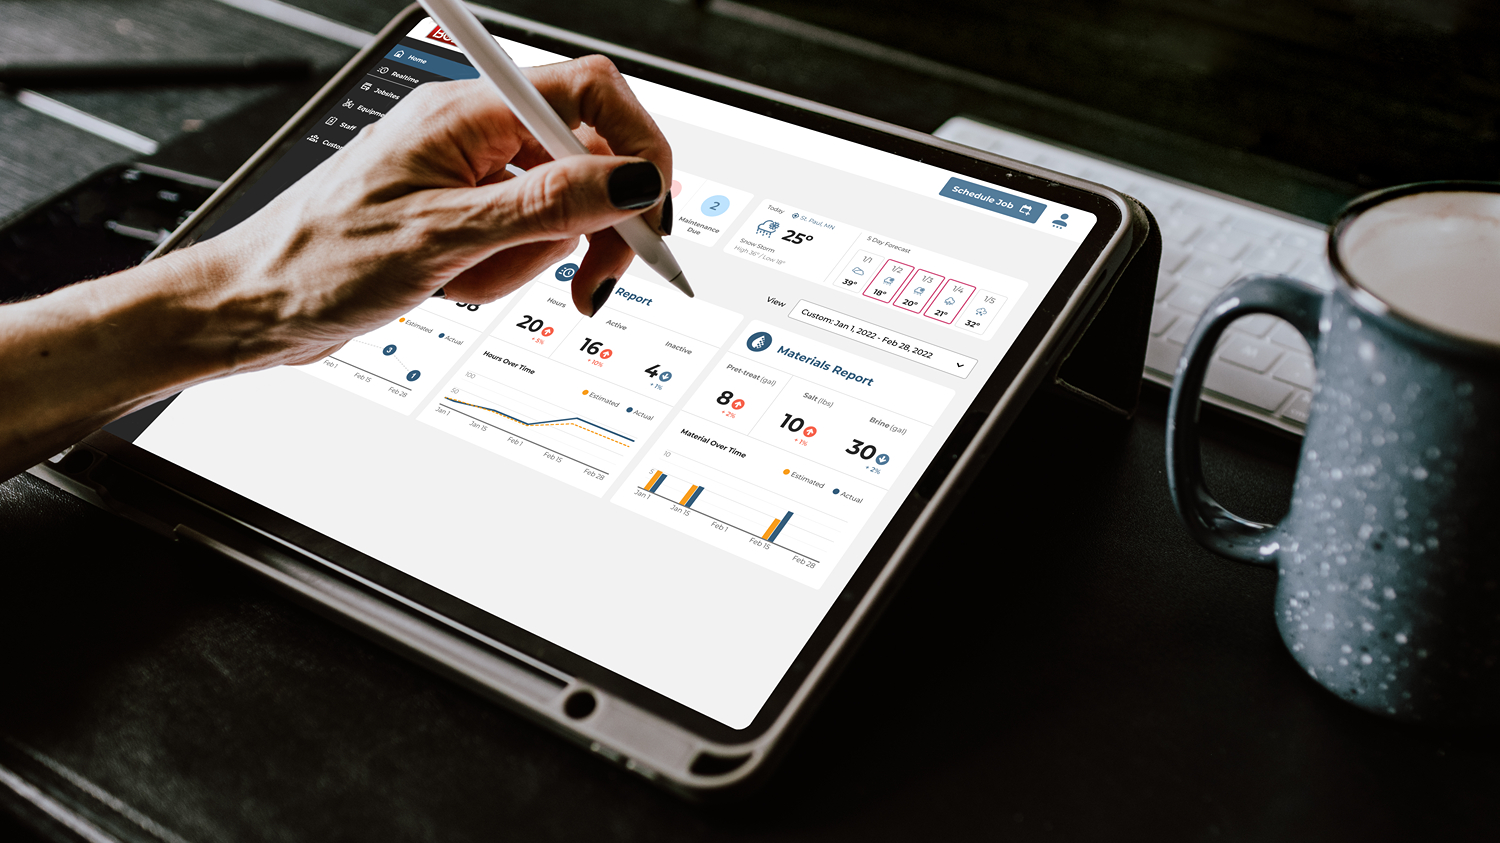
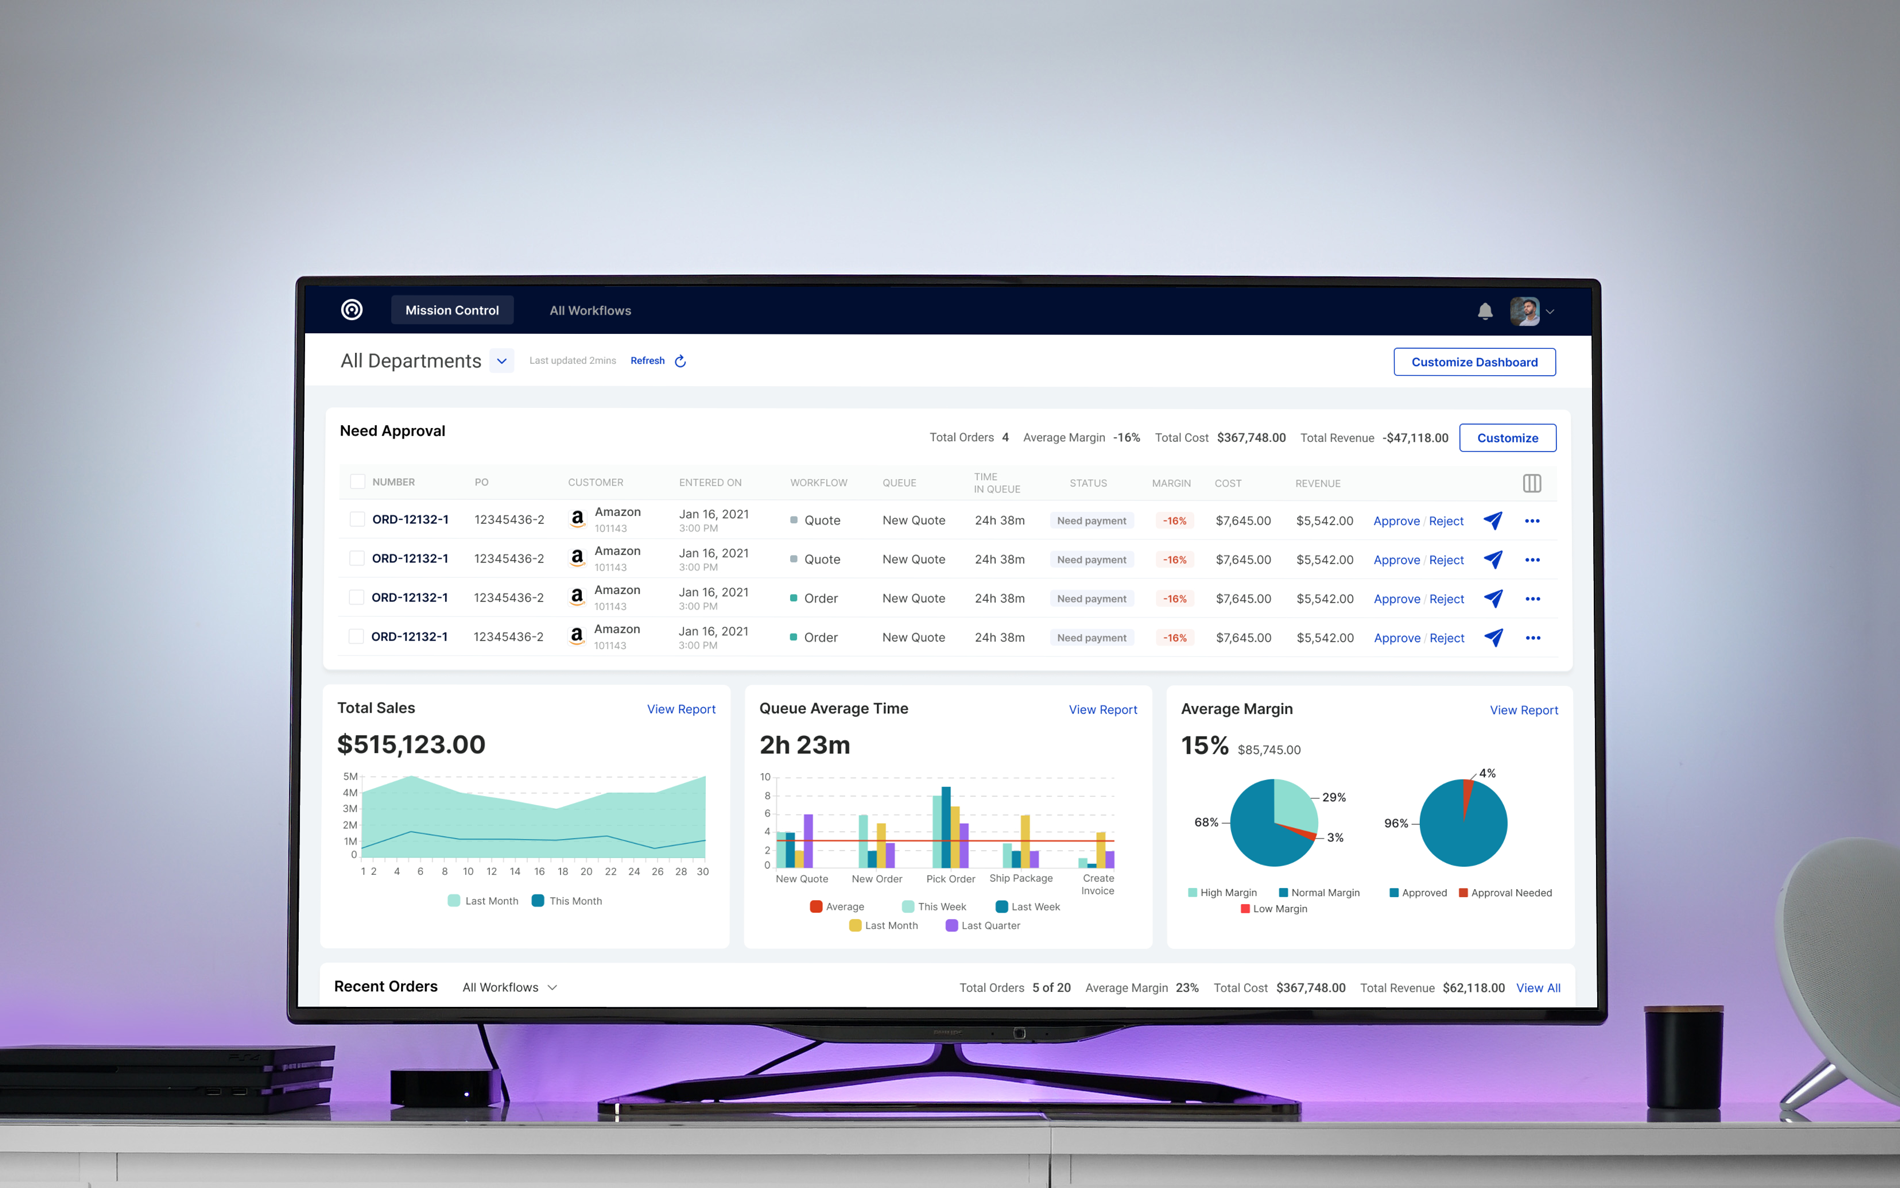
In this project, our team aimed to enhance the user experience of Mission Control, a cloud-based distribution software dashboard. The focus was on improving visualizations related to order throughput to increase usability and efficiency for users managing complex workflows.
The primary challenge was identifying and addressing usability issues within the existing dashboard, affecting users' ability to monitor and manage order throughput efficiently. The goal was to provide better visualization options and overall improvements to the dashboard interface based on user needs and preferences.
So how did we address this challenge?
Discovery Phase We began with a comprehensive review of the existing product to identify areas for improvement. This phase involved understanding the product's current capabilities and shortcomings, laying the foundation for further steps.
Discovery Phase We began with a comprehensive review of the existing product to identify areas for improvement. This phase involved understanding the product's current capabilities and shortcomings, laying the foundation for further steps.
Customer Interviews
We conducted in-depth interviews with users from various industries. These interviews provided invaluable insights into users' workflows, pain points, and specific requirements for order management and visualization.
We conducted in-depth interviews with users from various industries. These interviews provided invaluable insights into users' workflows, pain points, and specific requirements for order management and visualization.
Recommendations & Insights
We developed a robust list of recommended features, data visualizations, and widgets based on our findings. We prioritized these recommendations by considering customer desirability, technical feasibility, and alignment with Cavallo’s business strategy.
We developed a robust list of recommended features, data visualizations, and widgets based on our findings. We prioritized these recommendations by considering customer desirability, technical feasibility, and alignment with Cavallo’s business strategy.
Key focus areas included:
Notifications: Customizable alerts for order approvals, new customers, and critical order metrics. Profitability: High-level financial metrics like revenue and profitability trends. Order Status/Queue: Detailed tracking of orders through various stages and processing times. Human Performance Metrics: Metrics for staff performance to inform staffing decisions and recognize achievements. Inventory Management: Insights into inventory levels to balance stock and cash flow.
Notifications: Customizable alerts for order approvals, new customers, and critical order metrics. Profitability: High-level financial metrics like revenue and profitability trends. Order Status/Queue: Detailed tracking of orders through various stages and processing times. Human Performance Metrics: Metrics for staff performance to inform staffing decisions and recognize achievements. Inventory Management: Insights into inventory levels to balance stock and cash flow.

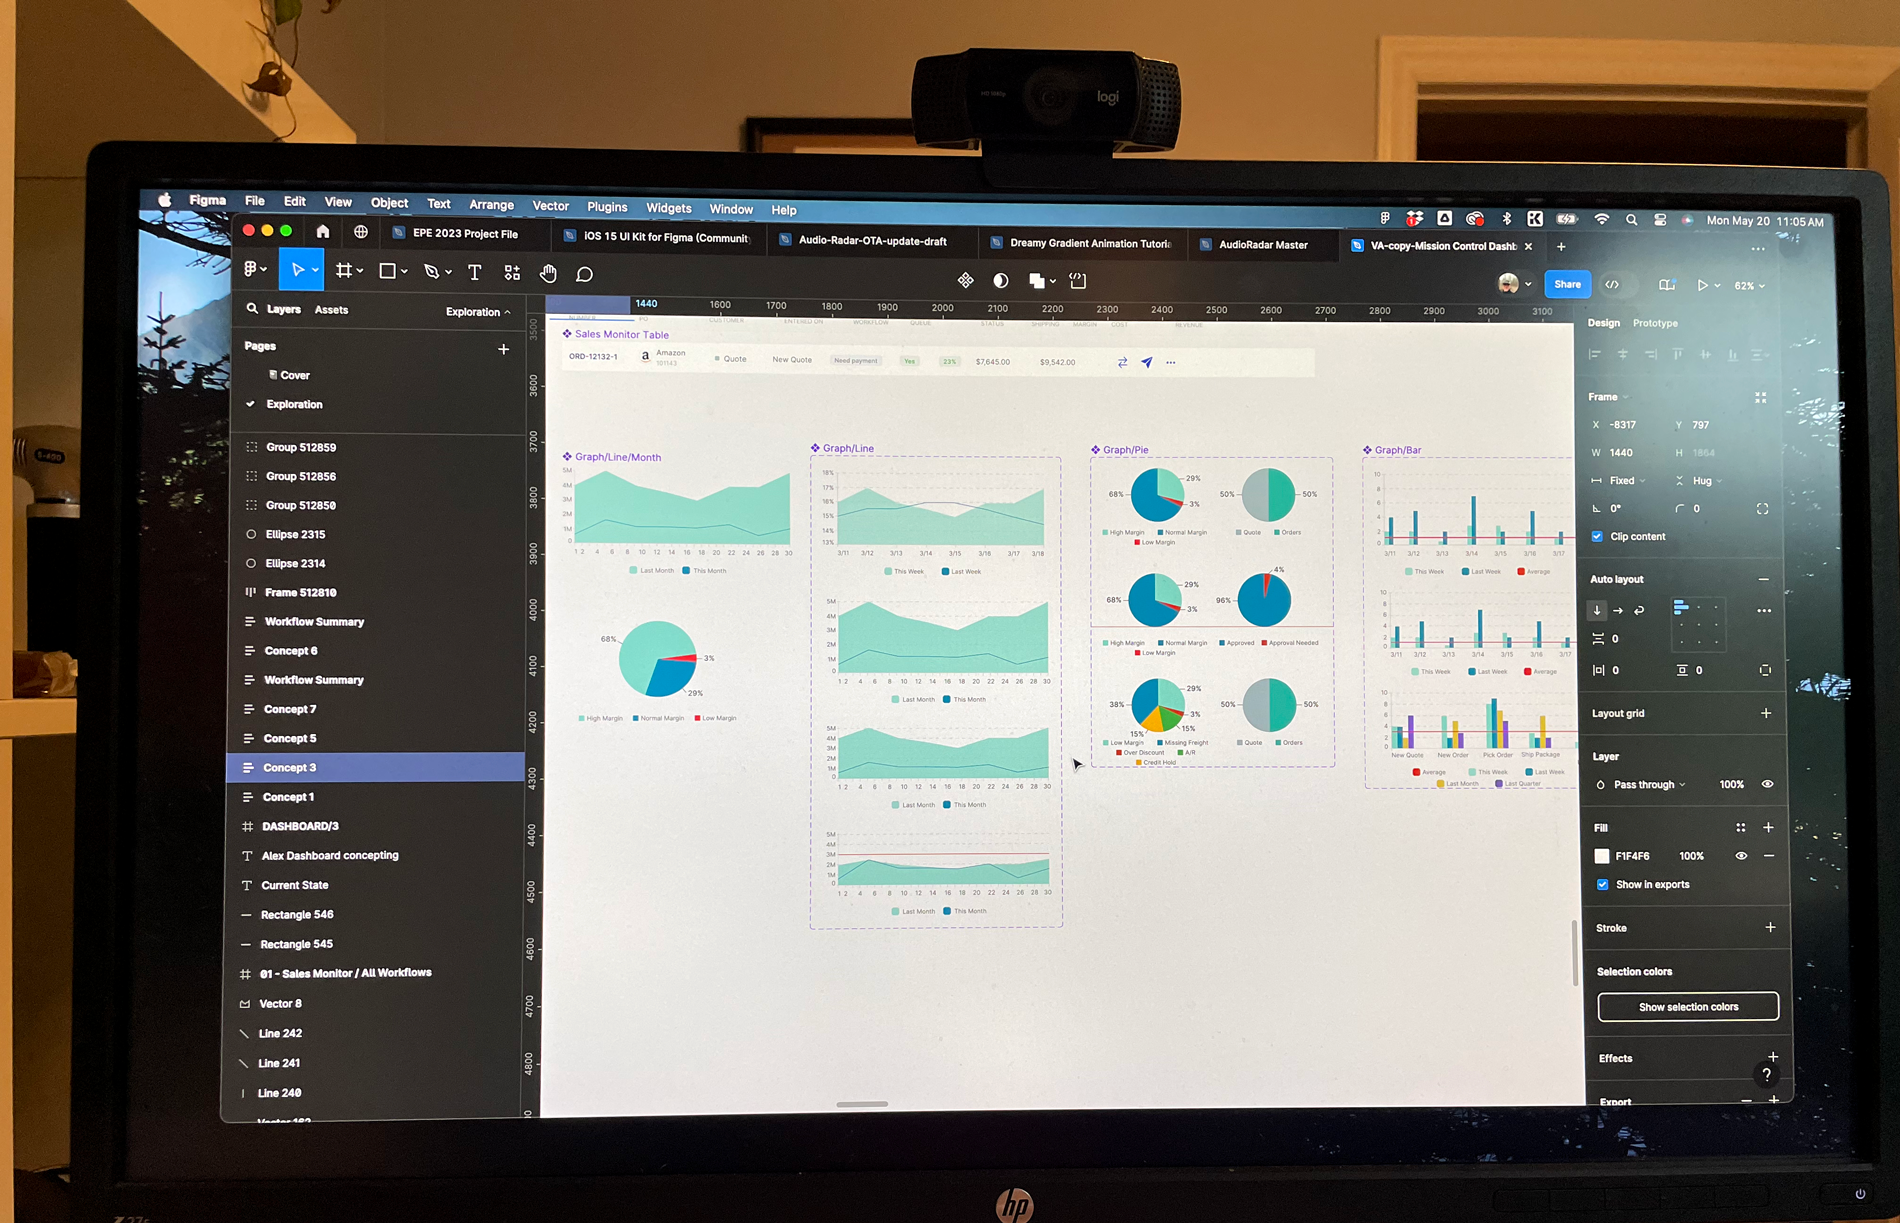
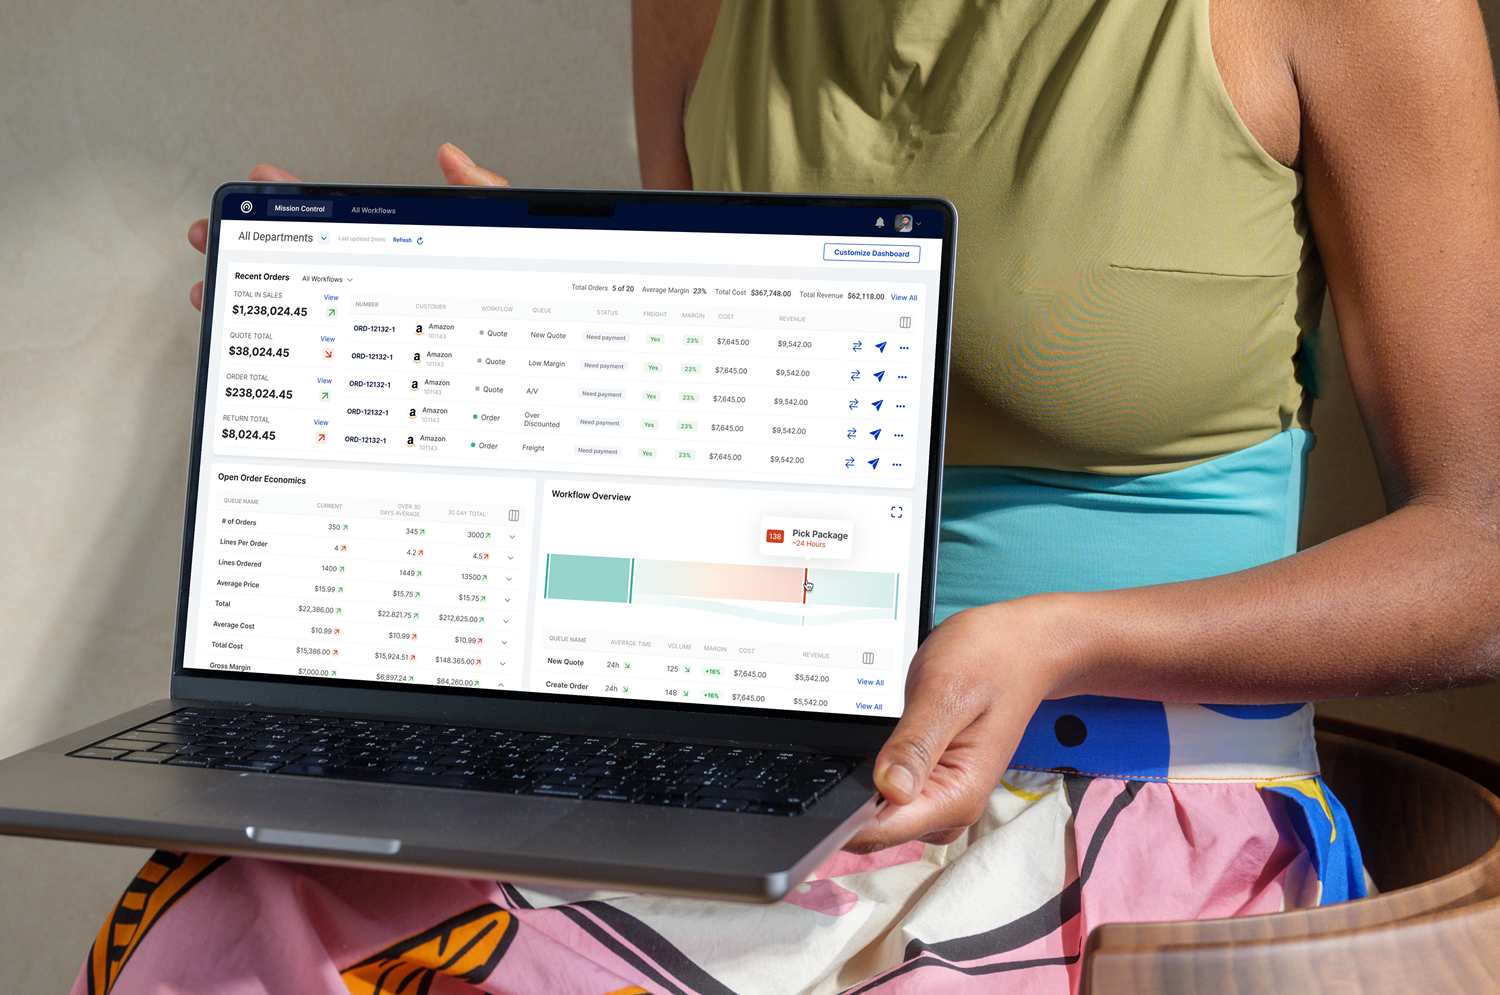
We refined the dashboard layout, streamlined navigation, and enhanced the user interface based on customer feedback. Four distinct visualization concepts for order throughput were developed and iteratively refined.
Prototyping and Testing To validate our design, we proposed building a full, clickable prototype, including key screens and drill-down details. Testing with at least eight users was recommended to gather further feedback and make necessary refinements.
What were the outcomes?
The structured process of discovery, user engagement, and iterative design led to several key outcomes:
Enhanced Usability: The improved dashboard layout and navigation made the platform more intuitive and efficient. Better Visualization: New visualization options provided users with deeper insights into their order processing workflows. Positive Feedback: Initial user testing indicated high satisfaction with the changes and suggested further areas for enhancement.
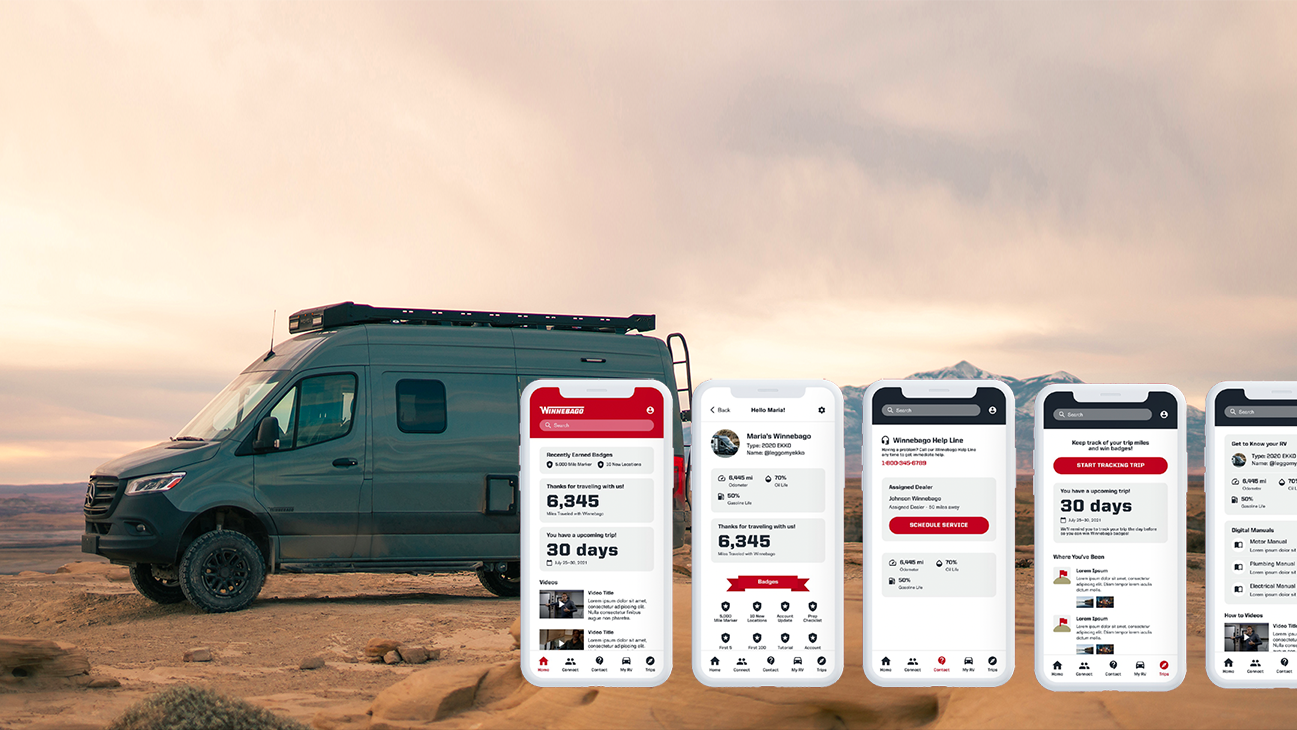
This project successfully enhanced the user experience of Mission Control by focusing on user-centric design and iterative improvement. The insights gathered from customer interviews and the resulting design changes significantly improved the platform's usability and efficiency. Future steps include advanced analytics integration, further customization features, mobile optimization, comprehensive user training, and establishing a continuous feedback loop to ensure ongoing improvements.